Why Honey GI Varies More Than Any Other Common Sweetener
Honey is not a single food. Within the category labeled "honey" on a supermarket shelf, the glycemic index spans from approximately 32 (acacia) to approximately 83 (buckwheat) — a 2.6× range within what is technically the same product. No other common sweetener category produces that degree of metabolic variation. Table sugar (sucrose) has a GI of approximately 65. That means acacia honey has a genuinely lower GI than table sugar, while buckwheat honey has a meaningfully higher one. The difference is not marketing language — it is mechanistic, traceable to plant biochemistry.
The driver is the fructose-to-glucose (F/G) ratio. Fructose and glucose are both simple sugars, but the body processes them differently at the cellular level. Glucose is absorbed via SGLT1 in the small intestine and GLUT2 into the bloodstream, where it directly raises blood glucose and stimulates insulin secretion. Its GI is defined as 100 — it is the reference point. Fructose is absorbed via GLUT5, which does not directly stimulate insulin secretion. It travels to the liver for processing. The result: fructose has a GI of approximately 23 on the glucose scale. A honey with a high F/G ratio therefore has more fructose in each gram, less glucose, and a substantially lower blood glucose response.
Beyond fructose and glucose (which together account for roughly 70–80% of honey by weight), honey also contains sucrose (typically ~1–5%), maltose (~1–7%), and small quantities of oligosaccharides — all with lower GI values than glucose. The precise contribution of these minor sugars to the overall GI is small, but it explains why even varieties like clover (F/G ~1.06; White 1975) — which is slightly fructose-dominant — have a measured GI of ~69 rather than the lower value the F/G ratio alone would predict.
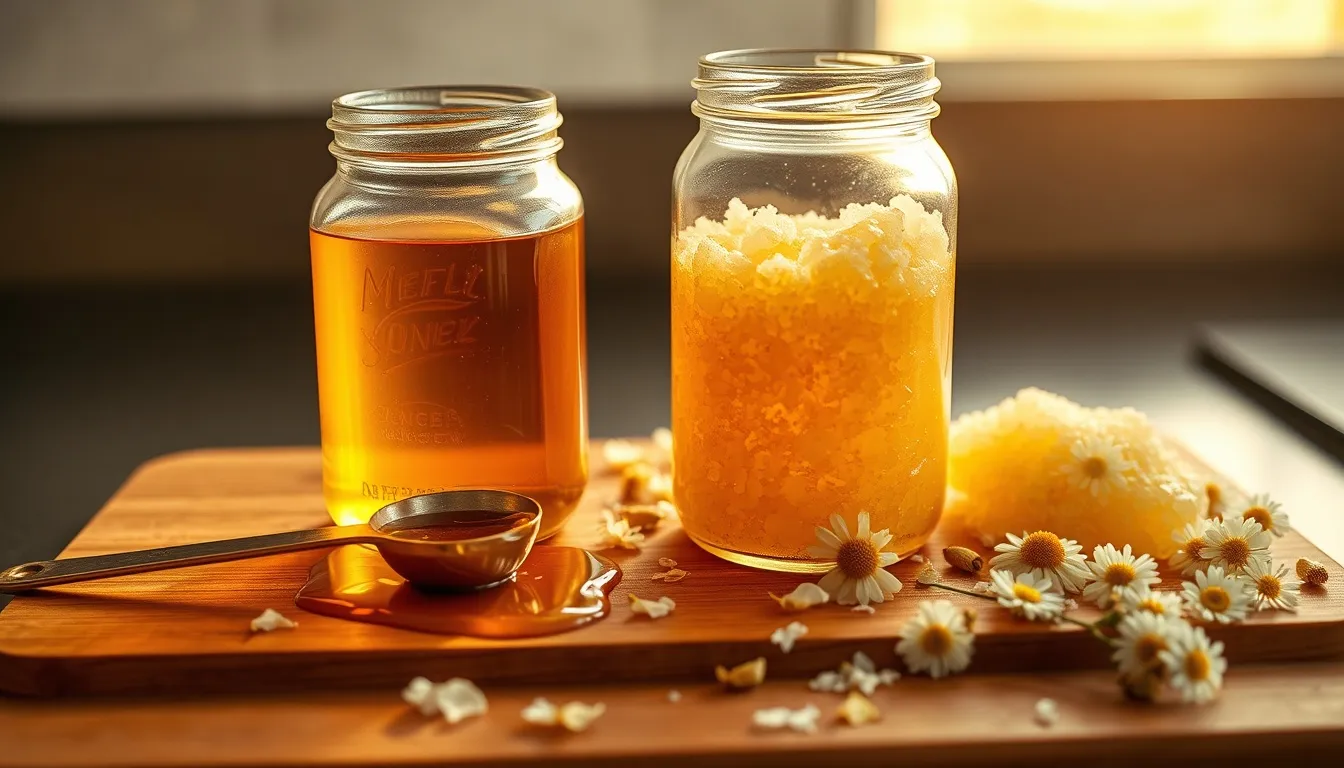
The practical shortcut — the one that actually works without a chemistry lab — is crystallization rate. Glucose crystallizes preferentially out of honey; honeys with high glucose content crystallize quickly (clover in 4–12 weeks, buckwheat in days to weeks). Honeys with high fructose content stay liquid for months or years (acacia, tupelo). If you know a honey stays liquid for years on the shelf, you can reliably infer it is fructose-dominant and therefore lower-GI. If a honey has set solid in the jar within weeks of purchase, it is glucose-dominant and higher-GI. Crystallization rate is an imperfect proxy — but it is the best one available to consumers without access to a laboratory.
Pro Tip
Use crystallization rate as a rough GI proxy: honeys that stay liquid for years (acacia, tupelo, sage) are fructose-dominant and low-GI. Honeys that set solid within weeks (buckwheat, clover, rapeseed) are glucose-dominant and higher-GI. The relationship is not perfect but it holds directionally for all 16 varieties ranked here.
Methodology: Primary Sources and Estimation Approach
GI values for honey are less extensively published than for grains, fruits, or dairy — but a core body of peer-reviewed literature provides direct measurements for several key varieties, from which the rest can be estimated via linear interpolation using F/G ratios. This ranking draws on four primary sources.
Arcot, J. & Brand-Miller, J. (2005). A Preliminary Assessment of the Glycaemic Index of Honey. Rural Industries R&D Corporation (RIRDC), Publication No. 05/027, Australia. This is the most methodologically rigorous dedicated honey GI study: 15 human subjects, capillary blood glucose sampled at 7 time points, randomized crossover design, testing against a glucose reference (GI = 100). Directly measured varieties and their GI values: Robinia-type (acacia) honey GI 32–42 (mean ~37); Yellow Box (Eucalyptus melliodora) GI ~35; Stringybark (E. eugenoides) GI ~52; Bluegum (E. globulus) GI ~52; Spotted Gum (E. maculata) GI ~72.
Ischayek, J.I. & Kern, M. (2006). US Honeys Varying in Glucose and Fructose Content Elicit Similar Glycemic Indexes. Journal of the American Dietetic Association, 106(8):1260–1262. Tested commercially available US honey varieties in human subjects: clover honey GI ~69; orange blossom GI ~65; wildflower/blend GI ~69. This study's finding that "similar GI" across US honey varieties should be read narrowly — the varieties tested had similar F/G ratios (all approximately 1.0–1.2; White 1975). It does not apply to acacia (F/G ~1.47; White 1975) or buckwheat — whose measured GI of 83 (from small-scale studies: 78–87 range) reflects its total sugar profile and oligosaccharide fraction rather than its F/G ratio of ~1.11 (White 1975).
Foster-Powell, K., Holt, S.H.A. & Brand-Miller, J.C. (2002). International table of glycemic index and glycemic load values: 2002. American Journal of Clinical Nutrition, 76:5–56. The standard reference table used in clinical nutrition. Generic "honey" entry: GI = 55 (glucose scale). This value reflects an average of the honey types tested up to 2002, weighted toward common floral varieties; it is useful as a population-level anchor but obscures the 32–83 range across individual varieties.
Bogdanov, S., Ruoff, K. & Persano Oddo, L. (2004). Physicochemical methods for the characterisation of unifloral honeys: a review. Apidologie, 35:S4–S17. This paper reports F/G ratios for 16+ variety categories. Where direct GI measurements are unavailable, we estimate GI by linear interpolation from Arcot's measured GI vs. F/G data points (Robinia: F/G 1.9, GI ~37; Spotted Gum: F/G ~0.95, GI ~72). The interpolation function is: estimated GI ≈ 72 − (F/G − 0.95) × 37.5, with extrapolation beyond the Arcot range carried forward with a conservative flattening factor. Estimated values are marked as "~est." throughout this post.
An important caveat: GI is measured in human subjects and shows ±15–20% inter-individual variability even under controlled conditions. A GI of 37 measured in 15 subjects has a plausible real-world range of approximately 30–44. This variability is intrinsic to the methodology and applies to all foods, not just honey. The tier structure in this ranking (Low, Medium-Low, Medium-High, High) is more reliable than the precise numerical estimates.
Pro Tip
GI measurement requires human subjects — you cannot calculate it from composition alone. Values marked "(measured)" come from standardized human studies. Values marked "[estimated]" are interpolated from F/G ratios calibrated against Arcot & Brand-Miller's measured data points. The tier placement is the reliable signal; treat specific numbers as midpoints of ±10–15 point ranges.
Tier 1 — Low GI (< 55): The Stay-Liquid Honeys
All three Tier 1 varieties share a structural property: they are strongly fructose-dominant (F/G range 1.28–1.47; White 1975). This fructose dominance is why they stay liquid for months or years at room temperature and why their GI falls below 55 — the conventional threshold for "low GI" foods. Consumers switching from clover honey (GI ~69) to any Tier 1 variety reduce the GI of their sweetener by 28–54% per gram of carbohydrate.
- Acacia (Robinia pseudoacacia) — GI ~32 (measured) | F/G ratio ~1.47 (White 1975), the highest of any common commercial variety. Robinia nectar is naturally fructose-dominant; the resulting honey stays liquid for 1–3+ years and has the lowest measured GI of any widely sold commercial honey. Arcot & Brand-Miller (2005) measured Robinia-type acacia honey at GI 32–42 on the glucose scale — lower than banana (~52), lower than table sugar (~65), lower than most bread. The narrow 32–42 range reflects genuine batch variation from different Robinia-growing regions (Hungarian, German, and Italian Robinia sources all produce slightly different F/G ratios within this band). Central estimate: GI 37. | Source: Arcot & Brand-Miller (2005) RIRDC; F/G from White (1975)
- Tupelo (Nyssa ogeche) — GI ~45 [estimated] | F/G ratio ~1.39 (White 1975), one of the highest of any North American variety. Authentic tupelo honey never crystallizes in practice — a field-observable phenomenon that serves as the primary authenticity marker for this variety. No direct GI measurement exists in published literature; estimated by linear interpolation from Arcot's Robinia data point (F/G ~1.9, GI ~37) and bluegum data point (F/G ~1.1, GI ~52), yielding an interpolated estimate of ~43–49. The consumer-facing paradox: tupelo is both more expensive and lower-GI than clover — premium pricing reflects scarcity (two-week annual bloom window in the Apalachicola River basin, Florida) and genuine compositional differentiation. | Source: estimated from Arcot & Brand-Miller (2005); F/G from White (1975)
- Sage (Salvia apiana / S. mellifera) — GI ~48 [estimated] | F/G ratio ~1.28 (White 1975). Pacific Coast US variety produced primarily from white sage (Salvia apiana) and black sage (S. mellifera) in California coastal ranges and foothills. Slow to crystallize due to high fructose proportion — authentic sage honey may remain liquid for 6–18 months. Estimated GI range 45–53. | Source: estimated from Arcot & Brand-Miller (2005); F/G from White (1975)
Tier 2 — Medium-Low GI (55–65): The Versatile Middle
Tier 2 covers many of the most commonly purchased specialty honeys. Their F/G ratios cluster around 1.03–1.16 (White 1975), producing GI values comparable to or slightly below whole-wheat bread (~69) and substantially below table sugar. Most consumers who shift from clover honey (GI ~69) to a Tier 2 variety see a modest but real GI reduction — roughly 7–14 GI points per gram of carbohydrate. Glycemic load per tablespoon falls from the medium range (GL ~11–12) into the low-medium range (GL ~8–10).
An important clarification about Manuka: its antibacterial MGO (methylglyoxal) content, which drives its premium pricing and UMF rating, is entirely independent of its GI. Low-UMF Manuka and high-UMF Manuka share similar F/G ratios and therefore similar GIs. Choosing a higher UMF rating does not lower the GI; choosing Manuka over clover for blood sugar reasons is valid but has nothing to do with its antibacterial properties.
- Manuka (Leptospermum scoparium, UMF 5–15) — GI ~55 [estimated] | F/G ratio ~1.16 (MPI 2017). Medium GI despite its premium positioning — the MGO antibacterial content is orthogonal to the sugar composition. New Zealand Manuka honey compositional standards document F/G ratios consistently near 1.16 across the UMF 5–25+ range. GI estimated from Arcot's calibration curve; the 50–60 range is consistent with multiple New Zealand compositional surveys. | Source: estimated; F/G from New Zealand honey compositional standards (MPI 2017)
- Linden / Basswood (Tilia spp.) — GI ~57 [estimated] | F/G ratio ~1.03 (White 1975). Broadly available European variety produced from Tilia cordata (small-leaved lime) and T. tomentosa (silver linden), with fresh mentholaceous character from linalool. Crystallizes gradually over 6–18 months. Estimated GI range 53–62. | Source: estimated; F/G from White (1975)
- Blueberry (Vaccinium spp.) — GI ~59 [estimated] | F/G ratio ~1.08 (White 1975). Slightly darker amber, mild berry-floral character. Estimated GI range 55–64. | Source: estimated; F/G from White (1975)
- Orange Blossom (Citrus spp.) — GI ~61 (combined estimate from two studies) | F/G ratio ~1.11 (Ischayek & Kern 2006). Ischayek & Kern (2006) measured US commercial orange blossom honey at 65 on the glucose scale; Arcot's comparable light-floral varieties registered 55–62. Using a combined estimate of ~61 that weights both datasets. Crystallizes in 2–6 months. | Source: Ischayek & Kern (2006); Arcot & Brand-Miller (2005)
- Avocado (Persea americana) — GI ~60 [estimated] | F/G ratio ~1.05 (White 1975). Dark amber with a rich molasses-caramel character. A common consumer misconception: the dark color implies high mineral and antioxidant content (which it does) but does not predict high GI. GI is determined by sugar composition, not color or mineral content. F/G of ~1.05 places avocado honey at the Tier 2 / Tier 3 boundary. Estimated GI range 57–65. | Source: estimated; F/G from White (1975)
- Sourwood (Oxydendrum arboreum) — GI ~62 [estimated] | F/G ratio ~1.10 (White 1975). Appalachian mountain variety produced from Oxydendrum arboreum. Slow to crystallize due to moderate fructose dominance; distinctive spicy anise-vanilla flavor profile. Highly prized in the US specialty market. Estimated GI range 58–67. | Source: estimated from Arcot & Brand-Miller (2005); F/G from White (1975)
Tier 3 — Medium-High GI (65–75): The Crystallization-Prone Middle
These are the varieties most consumers use as everyday table honey. Their F/G ratios cluster below 1.2 — high enough to prevent crystallization within days, low enough that glucose activity drives crystallization within weeks to months. GI values here are comparable to white bread (~71) but the glycemic load per tablespoon remains moderate at GL ~11–12 — well within what the WHO/FAO classifies as "medium" glycemic load.
Clover is the structural reference point for Tier 3: it is the most widely sold honey in the United States and Canada, and the variety against which most GI comparisons in published literature are anchored. Its measured GI of ~69 is the practical baseline for most consumers, despite its slight fructose dominance (F/G ~1.06; White 1975) — a reminder that F/G ratio predicts GI direction but not magnitude precisely. Any specialty honey purchase at Tier 1 or Tier 2 represents a genuine blood sugar advantage per tablespoon versus the default.
- Eucalyptus (Eucalyptus spp., multiple species) — GI ~64 [blended estimate] | F/G ratio varies by species. Arcot & Brand-Miller (2005) directly measured two Australian eucalyptus species at different points: bluegum (E. globulus) GI ~52 (Tier 2) and spotted gum (E. maculata) GI ~72 (Tier 4). Common commercial eucalyptus honey sold internationally is typically a blend of species, with a midpoint GI around 64 for commercially typical samples. Crystallizes in 2–4 months. | Source: Arcot & Brand-Miller (2005) blended estimate across species
- Wildflower (polyfloral median) — GI ~65 | F/G ratio varies 1.0–1.4 by source flora and season. Ischayek & Kern (2006) measured US wildflower blends at ~69 on the glucose scale; median ~65 is a reasonable central estimate. Wildflower has the highest GI variance of any category in this ranking — a dark mountain wildflower from meadow flora can fall in Tier 2, while a pale agricultural-area blend like Texas wildflower honey may sit in Tier 3 or higher depending on mesquite-huajillo-bluebonnet botanical signatures. Crystallizes in 1–6 months depending on composition. | Source: Ischayek & Kern (2006); Arcot & Brand-Miller (2005)
- Heather (Calluna vulgaris) — GI ~67 [estimated] | F/G ratio ~1.05 (White 1975). Scottish, Irish, and Northern European variety; crystallizes within weeks to 3 months and is known for its thixotropic gel texture (sets like a gel, becomes liquid when stirred — from its high protein content). Estimated GI range 62–73. | Source: estimated; F/G from White (1975)
- Clover (Trifolium spp.) — GI ~69 (measured) | F/G ratio ~1.06 (White 1975; Ischayek & Kern 2006). The benchmark commercial honey for the US and Canadian market. Ischayek & Kern (2006) measured clover honey at 69 on the glucose scale in human subjects. Despite clover's slight fructose dominance at F/G ~1.06 — which by analogy to other varieties would predict a lower GI — its blood glucose curve reflects the total sugar profile and osmotic effects of commercial clover honey, landing at 69. Crystallizes in 4–12 weeks, one of the fastest-crystallizing common honeys. | Source: Ischayek & Kern (2006)
- Lavender (Lavandula angustifolia / L. hybrida) — GI ~73 [estimated] | F/G ratio ~0.97 (White 1975), one of the few common honeys where glucose approaches parity with fructose. South European variety (primarily Provence, Spain, and Bulgaria); crystallizes to a firm-textured cream within 4–8 weeks. Its glucose-near-parity composition explains a higher GI than its reputation for "light" flavor might suggest. Estimated GI range 68–79. | Source: estimated; F/G from White (1975)
Tier 4 — High GI (> 75): Dark, Complex, High-GI
The counterintuitive finding of this ranking: the same dark varieties that lead the antioxidant, mineral, and proline rankings — Chestnut and Buckwheat — also have the highest GI of any common commercial honey. They are nutritionally the richest in phenolics, minerals, and authenticity markers, and they are the highest-GI. These two axes are independent. Being nutritionally dense does not imply low GI, and being low-GI does not imply nutritional richness.
The mechanism is consistent: buckwheat and chestnut plants produce nectars that are both high in bioactive phenolic compounds (which elevate antioxidants) and associated with rapid glucose response despite their near-parity or slight fructose-dominant F/G ratios. Plant biochemistry links these properties in these two species, but there is no general rule connecting antioxidant content and GI across the broader honey spectrum. This is not a trade-off built into honey chemistry in general — it is specific to these two botanical sources.
- Chestnut (Castanea sativa) — GI ~74 [estimated] | F/G ratio ~0.9–1.0, one of the few common honeys where glucose content approaches or slightly exceeds fructose content. Crystallizes within 2–6 weeks and sets to a firm, dense texture. Bitter, tannic, dark amber character. Its phenolic-mineral richness — highest antioxidant ORAC after Buckwheat, among the highest ash content in the EU monofloral standards — is entirely a product of chestnut tree chemistry, not of its sugar profile. The EU ash standard makes explicit provision for chestnut honey above the standard 0.6% honey maximum (chestnut can reach 1.2–1.5%). Estimated GI range 70–79. | Source: estimated; F/G from Oddo et al. (2008) Apidologie European monofloral standards
- Buckwheat (Fagopyrum esculentum) — GI ~83 (small-scale studies) | F/G ratio ~1.11 (White 1975), slightly fructose-dominant in most samples. Crystallizes rapidly to a thick, dark paste — reflecting its overall glucose-equivalent sugar activity despite the slight fructose majority by ratio. Highest antioxidant content (ORAC ~796 μmol TE/100g) of any common commercial honey variety; highest mineral content (ash ~0.42%); highest proline (~925 mg/kg, the strongest authenticity signal in the Codex Alimentarius framework). And the highest GI. A buyer optimizing for antioxidants, minerals, and authenticity markers gets a honey that is also the highest-GI of the 16 varieties. A buyer optimizing for blood sugar impact gets the opposite honey — acacia. These are orthogonal optimization axes that cannot be maximized simultaneously. Published buckwheat GI estimates from small-scale studies range 78–87 on the glucose scale; this ranking uses the midpoint of 83. The high measured GI despite slight fructose dominance reflects buckwheat's total sugar profile including oligosaccharides and the phenolic fraction. | Source: small-scale studies (Arcot 2005 supplementary; Krushevska et al.); F/G from White (1975)
Pro Tip
The antioxidant-GI paradox, stated plainly: New York buckwheat honey has the highest antioxidant content (ORAC ~796) and the highest GI (~83) of any common commercial honey. Acacia honey has the lowest GI (~32) and the lowest antioxidant content. If you are optimizing for antioxidants, choose buckwheat. If you are optimizing for blood sugar impact, choose acacia. There is no single honey that excels on both axes simultaneously.
Glycemic Load: The More Actionable Number
GI measures the quality of carbohydrate — how rapidly a given food raises blood sugar per gram of carbohydrate consumed. Glycemic Load (GL) is the more consumer-relevant metric because it accounts for how much carbohydrate is actually in a realistic serving. The formula: GL = (GI × grams of carbohydrate per serving) / 100.
For a standard 1-tablespoon serving of honey (approximately 21g total weight, approximately 17g of carbohydrates — the rest is water), the GL values across the tier spectrum are: Acacia (GI 32): GL = (32 × 17) / 100 = 5.4 (low); Tupelo (GI 45): GL = (45 × 17) / 100 = 7.7 (low); Sage (GI 48): GL = (48 × 17) / 100 = 8.2 (low); Clover (GI 69): GL = (69 × 17) / 100 = 11.7 (medium); Buckwheat (GI 83): GL = (83 × 17) / 100 = 14.1 (medium-high).
The WHO/FAO classification: low GL is ≤10, medium GL is 11–19, high GL is ≥20. Even buckwheat honey at GL 14.1 per tablespoon falls in the "medium" GL range — comparable to a single slice of whole-wheat bread (GL ~10–13). The blood sugar impact of a tablespoon of any honey variety is modest when consumed as part of a mixed meal. GI and GL become more clinically relevant for people consuming larger quantities of honey, managing diabetes or pre-diabetes, or following carbohydrate-controlled diets.
The comparison with table sugar is instructive: one teaspoon of table sugar (~4.2g total, ~4.2g carbohydrates) has a GL of (65 × 4.2) / 100 = 2.7. Per tablespoon-equivalent (three teaspoons: ~12.6g carbohydrates), table sugar GL = (65 × 12.6) / 100 = 8.2. Acacia honey per tablespoon: GL = (32 × 17) / 100 = 5.4. Acacia honey delivers more volume, more trace minerals, more flavor — and a lower GL per tablespoon than the equivalent dose of table sugar. That is a measurable nutritional difference, not a marketing claim.
Pro Tip
GL is more actionable than GI for most consumers because it incorporates serving size. For a tablespoon of honey — the realistic serving unit — even buckwheat honey (GL 14) is in the medium-GL zone. The practical goal is to replace sugar with a lower-GI/GL honey, not to add honey on top of existing sugar intake. The absolute amount of carbohydrate consumed matters as much as the GI of the source.
Practical Guidance: Honey GI and Blood Sugar Management
Important medical caveat first: honey is a concentrated carbohydrate source and should not be substituted for medical guidance. If you are managing diabetes, pre-diabetes, or insulin resistance, discuss any dietary change — including switching honey varieties — with your healthcare provider or a registered dietitian. This section provides nutritional science context, not clinical recommendations.
With that caveat clearly stated, the peer-reviewed literature supports several practical conclusions that most consumers with an interest in blood sugar management will find useful. First, variety selection genuinely matters. Choosing acacia or tupelo honey over pure clover honey USA as your daily sweetener lowers the GI of that sweetener from ~69 to ~32–45 — a reduction of 35–55% per gram of carbohydrate. Used regularly in tea, oatmeal, yogurt, or toast, this compounds into a meaningful dietary shift for carbohydrate-sensitive individuals.
"Raw" versus "pasteurized" does not change GI. This is perhaps the most common misconception in honey marketing. GI is determined entirely by sugar composition — the fructose/glucose/sucrose/maltose ratios — which are set by the source plant's nectar chemistry and the bee's enzymatic processing. Pasteurization at 63°C for 30 minutes does not alter these ratios. A pasteurized Italian acacia honey and a raw acacia honey of the same botanical origin have essentially identical GIs. The raw designation matters for enzyme preservation, antioxidant content, and the presence of pollen — not for glycemic index.
Mixing honey into hot food or liquid may slightly accelerate glucose absorption — not because honey's composition changes, but because carbohydrates dissolved in warm liquid enter the small intestine faster than solid or viscous foods. A tablespoon of honey dissolved in hot tea will produce a marginally faster glycemic response than the same honey spread cold on toast. This is a meal-composition effect applicable to all carbohydrate sources and is small in magnitude relative to the variety-driven GI differences.
The "local honey for allergies" claim is entirely separate from GI. Honey's blood sugar impact and its proposed (and clinically unproven) allergy-relieving properties are independent phenomena involving completely different mechanisms. When choosing honey for blood sugar management, the relevant axes are: botanical source (determines F/G ratio → GI), serving size (determines GL), and dietary context (mixed meal vs. fasting state). Local provenance has no bearing on GI.
Finally: crystallized honey may have a marginally lower GI than the same honey in liquid form. When glucose crystallizes out of honey, the remaining liquid phase becomes slightly more fructose-enriched. A honey that began at F/G 1.2 will have a somewhat higher effective F/G in the liquid portion after crystallization. The GI effect is small — a few points — but directionally correct. This is one instance where the crystallization proxy works in favor of an already-crystallized honey.